Year-by-Year Projections
See your future year-by-year with comprehensive cash flow, taxes, and account balances.
NestMint helps you model your financial future with clarity — so you can make smarter decisions, reach your goals, and enjoy what matters most.
Everything you need to plan, model, and project your financial future with confidence.
See your future year-by-year with comprehensive cash flow, taxes, and account balances.
Compare strategies side-by-side to reduce projected taxes and support lifetime wealth.
Visualize thousands of market scenarios and understand the range of possible outcomes.
Plan ahead for taxes, RMDs, and IRMAA surcharges with proactive insights.
Start strong, build smart habits, and watch your money grow.

Make informed decisions and transition into retirement with clarity.

Protect your wealth and enjoy peace of mind through every year.

Start with a 14-day free trial. No credit card required. Cancel anytime.
Full access, month to month. Cancel anytime.
Save 25% versus monthly — equivalent to $7.50/mo.
Pay once, plan forever. Limited to first 500 members.
All plans include a 14-day free trial. No credit card required to start. Beta access code required during closed beta.
Take control of your financial future with NestMint.
Already have an account? Log in

NestMint Workplace
NestMint Workplace helps employees and retirees plan for today and tomorrow with confidence.
Build a strong financial future with tools to plan, save, and stay on track.
Make informed decisions and create sustainable income in retirement.
Set goals, estimate outcomes, and build a plan that fits your future.
Model retirement income and create a withdrawal strategy you can count on.
Compare options side-by-side to find the strategy that aligns with your goals.
Explore different scenarios to prepare for life’s twists and turns.
Your information is protected with industry-leading security and privacy standards.
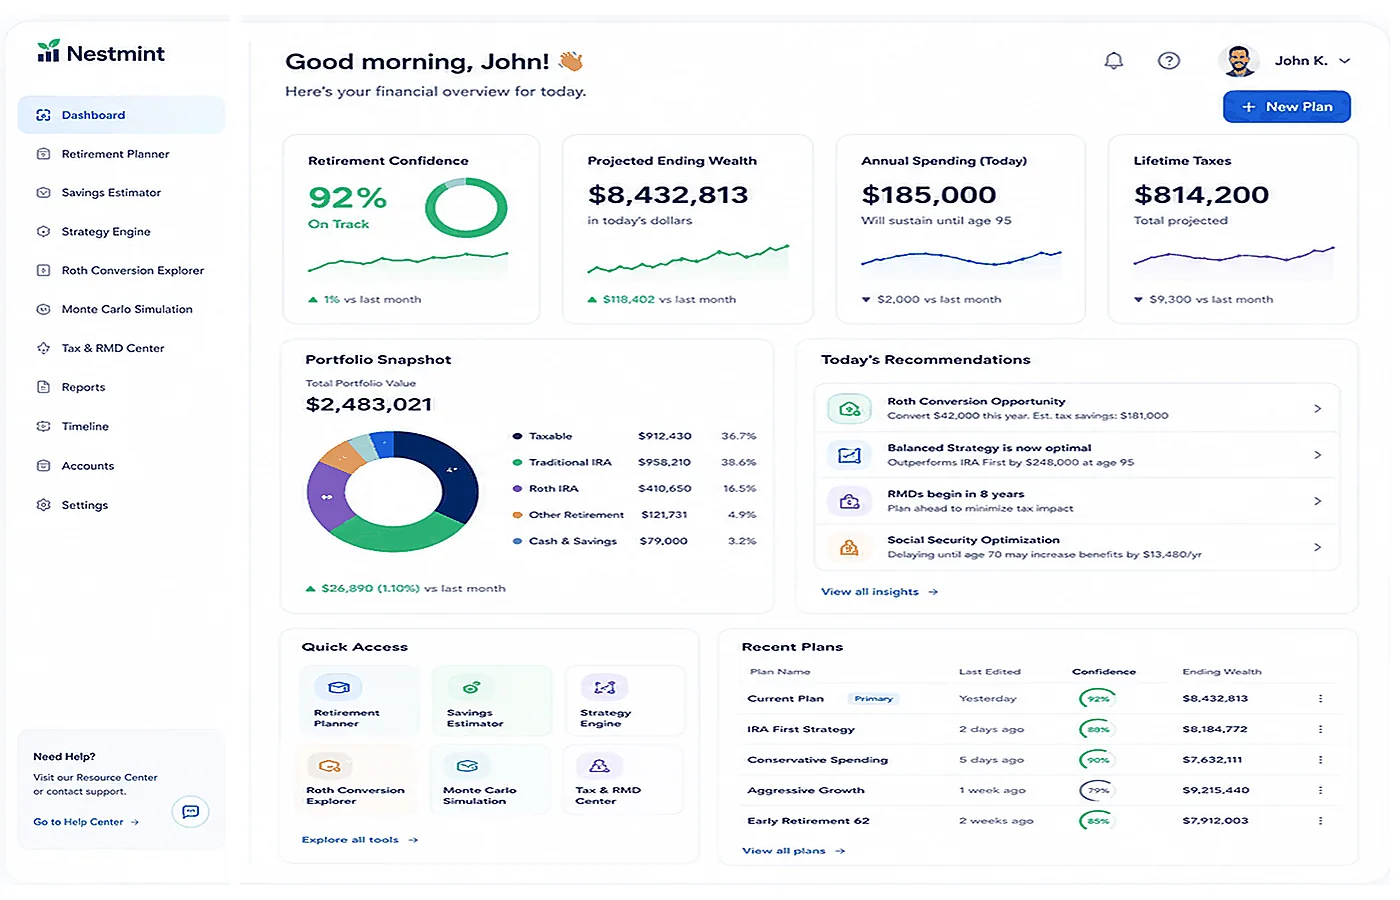
Here’s your financial overview for today.
Open Monte Carlo to calculate a modeled success rate.
Run the Retirement Planner to populate this metric.
From your current plan assumptions.
Run the Retirement Planner to populate this metric.
Run a simulation in the Retirement Planner to populate plan metrics and recommendations.
Open Savings to set your ages, balances, contributions, and target — your growth plan appears here.
See how your savings today can shape your retirement tomorrow.
Enter your balances and contributions in Savings — your projection appears here.
Run the Retirement Planner to activate your plan.
—
No income modeled.
Annual Spending
—in today's dollarsBased on the account balances in your current plan.
Run a retirement simulation to receive plan-specific next steps.
Run a simulation in the Retirement Planner to see projected annual spending by age.
From the current deterministic projection.
Run a simulation in the Retirement Planner to see projected annual taxes by age.
Summed per year from the same projected tax rows as the Lifetime Taxes metric.
Name your plan, review the Input Summary, then adjust any section in the guided planner.
Please enter a plan name.
See how small, consistent savings turn into serious wealth over time.
All sections are filled from your current inputs. You're ready to run the projection.
All changes saved
Brokerage accounts, savings, CDs, etc. — taxed differently from retirement accounts.
Your gross annual employment income. Used to check Roth IRA eligibility, compute employer-match cap (if configured), and project your current-year tax bracket.
Expected yearly raise. Grows the salary your employer match is computed on. Leave blank to use your Annual Increase rate.
Adds your spouse's savings to the household projection. They share your retirement timeline, investment return, annual increase, and salary growth; their salary, contributions, employer match, and starting balance are their own.
Monthly pre-tax 401(k)/IRA contribution.
Monthly Roth contribution.
Match limited to this percent of their salary (§401(a)(17) pay cap applied to their salary separately).
Seeded as traditional retirement savings.
Money you save each month into a regular taxable brokerage account. Grows in its own bucket — no contribution limit and no employer match.
Traditional and Roth are your 401(k)/IRA contributions. The employer match below applies to their combined total (not to brokerage).
One rate for raises: it grows your contributions each year and your salary, so the employer-match ceiling below grows with your pay.
Match cap is computed against the Annual Salary in the Compensation section above, indexed each year by your Annual Increase. IRS rules (§401(a)(17)) cap matchable pay at $360,000 (2026, indexed). Leave both fields at 0 if you have no employer match.
Percentage of your contribution the employer matches (e.g. 50% = $0.50 per $1 you contribute).
Maximum % of salary the employer will match on (e.g. 6% means they only match up to 6% of your salary).
Traditional is the default and most common (employer match is pre-tax). Some plans offer Roth-match under SECURE 2.0 — you pay tax on the match amount in the current year but the balance grows tax-free.
Note: Salary is treated as fixed for the entire projection period. The employer match cap is based on the Compensation salary each year, even if your contributions increase annually.
Under SECURE 2.0 a high earner’s 401(k) catch-up must be Roth — with no Roth option there is no catch-up.
Used by both Roth tools below — conversion math and contribution-bucket eligibility.
Used to personalize tool suggestions and milestone labels
Set different return rates for different year ranges.
Contributions are assumed to occur evenly throughout the year. Monthly is the most realistic for typical investments.
Target value renders from your saved goal in Goal Simulator.
Projected from current assumptions; not a guarantee.
Traditional + Roth + brokerage
Projected across the savings horizon
Across retirement and taxable accounts
Traditional, Roth, and brokerage balances — with the total — through retirement age.
The estimator preserves the four retirement-account buckets and taxable savings throughout the projection.
Use the estimate to begin spending, tax, healthcare, and withdrawal modeling.
| Timeline | Balances & Contributions | Investment Growth | Projected Outcome | |||||||||
|---|---|---|---|---|---|---|---|---|---|---|---|---|
| Year | Age | Beg. Balance | Mo. Contrib | Annual Contrib | Empl. Match | Cumul. Contrib | Interest (Yr) | Cumul. Interest | End Balance | % From Growth | Real Balance (today's $) | Mo. Income @ 4% |
See how much free money you're leaving on the table. Enter your employer's match terms.
% of your contribution they match
Max % of salary they'll match on
Track when you'll hit key savings milestones. Based on your current inputs.
How should you split your annual retirement contributions across Roth IRA, Roth 401(k), Traditional 401(k), and Traditional IRA? See your capacity, allocate across the four buckets, and watch how the choice plays out over your time to retirement.
All three scenarios use the same contribution dollars, employer match, and growth rate, so the pre-tax balance is the same. Only the after-tax keep amount changes based on how the money is split between Traditional and Roth. Traditional balances are subject to required minimum distributions beginning at age 73–75; Roth balances are not.
Note: These projections cover retirement accounts only (Traditional & Roth 401(k) and IRA balances). Brokerage and taxable savings are excluded — see the Savings Estimator dashboard for your full total including non-retirement accounts.
Important: The lost tax deduction can represent a significant drag on the Roth advantage shown above. If a Traditional contributor were to reinvest those tax savings and let them compound over the full savings horizon, the result would partially offset Roth's edge.
Should you convert some of your traditional IRA/401(k) to a Roth before retirement? Pay tax now at your known bracket, then grow and withdraw tax-free. Reduces future RMDs and Medicare surcharges.
Standalone planning tool: these assumptions are entered here and are not automatically synchronized with your active plan.
Once you stop working, income drops — but so does your control over it. RMDs starting at age 73–75 force withdrawals from your IRA whether you need the money or not, at ordinary income rates, in amounts that grow every year as your balance compounds.
The years between now and retirement are different. Your bracket is known. Your timeline is long. And every dollar you move to Roth now compounds tax-free for decades.
The question isn't whether to convert. It's how much, and when.
Federal + state, during conversion window
Federal + state, in retirement
See the cost of waiting. Compare starting today vs. delaying by 1, 3, 5, or 10 years.
Figure out how much to put into each account type based on your income and risk tolerance. Follows the classic priority order: get the employer match, then max tax-advantaged accounts. (2026 IRS limits)
Standalone planning tool: these assumptions are entered here and are not automatically synchronized with your active plan.
Over $150,000 makes any 401(k) catch-up Roth-only (SECURE 2.0).
If you're 50+, IRS rules let you contribute extra to 401(k) and IRA accounts. See how much more you could save. (2026 limits)
Standalone planning tool: these assumptions are entered here and are not automatically synchronized with your active plan.
What if you had started saving with your current contribution plan 30 years ago? This compares your flat-rate projection against what actually happened in the S&P 500 — including the dot-com crash, 2008 financial crisis, and COVID. See how real market volatility would have affected your savings growth.
| Year | Annual Contribution | Cumulative Contributions | Total Investment Growth | End Balance |
|---|
| Scenario | Updated | Projected at retirement | Target | Status |
|---|
Explore different savings scenarios — solve for the missing variable.
Auto-filled from "Your Savings Today" — edit to override. Applies to all simulators below.
The total balance you want to reach. Seeds the cards below and powers the Savings Estimator goal-gap insight.
How much do I need to save each month to reach my goal?
How many years will it take to reach my savings target?
What annual return rate do I need to hit my savings target?
What will my balance be at a specific age given my current plan?
Tell us about you and your household.
This information helps personalize your plan and projections.
Your age as of today.
Pins RMD, 59½ / 70½ and Medicare timing to the right year. Blank = inferred from age.
Age you expect to live to.
Number of years to include in this plan.
Tell us about your household and partner.
Age you expect your spouse / partner to live to.
Portion of pension or income that continues to survivor.
Expected spending as a % of pre-death spending.
Enter your account balances and key assets for the plan.
Fills these account balances from your Savings Estimator result. Uncheck to enter your own balances.
Enter your income sources for retirement.
Estimate your Social Security benefit.
Enter the monthly benefit amount used by the retirement engine.
Estimate your spouse / partner's Social Security benefit.
The spousal benefit is set automatically to 50% of your monthly amount.
The engine stores Social Security as a monthly benefit.
Add your defined benefit or other pension income.
Add spouse / partner pension income.
Add recurring employment or other income already supported by the planner.
Add spouse / partner employment income and contributions while working.
Contributed to the spouse's traditional account during the employment window.
Organize your retirement spending plan and major cash flow events.
Amounts are in today's dollars and increase with your inflation assumption.
When on, your Budget view's total keeps the annual spending amount in sync.
Define how your spending changes across retirement.
Phases are contiguous — each phase starts where the previous one ends. The last phase covers all remaining years.
Adjust spending when the portfolio crosses your selected guardrails.
Guyton-Klinger style: spending adjusts for inflation, then rises or falls when the withdrawal rate crosses a guardrail, within the floor and ceiling.
Add major planned events that impact your cash flow.
Plan a property sale and, optionally, your next home purchase. Enter each sale here rather than adding it again as a deposit. Net sale proceeds go to your taxable brokerage account.
Enter an expected sale price, or estimate it using today’s value and annual appreciation.
A sale price above $0 overrides the value-and-growth estimate. Blank appreciation uses your plan’s inflation rate.
Cost basis is the original purchase price plus qualifying improvements. Tax on the sale’s gain is paid from the sale proceeds first; any shortfall follows your tax-funding order.
No home-sale exclusion is applied until full eligibility is confirmed. Review the eligibility and modeling notes below.
Leave the purchase price at $0 if you are not buying another home. Purchase year and month default to the sale date.
The purchase price minus the new mortgage is withdrawn in the purchase month and year. Sale proceeds stay invested and available in brokerage, not held in escrow. Include ongoing mortgage payments or rent in Spending.
Enter an expected sale price, or estimate it using today’s value and annual appreciation.
A sale price above $0 overrides the value-and-growth estimate. Blank appreciation uses your plan’s inflation rate.
Cost basis is the original purchase price plus qualifying improvements. Tax on the sale’s gain is paid from the sale proceeds first; any shortfall follows your tax-funding order.
No home-sale exclusion is applied until full eligibility is confirmed. Review the eligibility and modeling notes below.
Leave the purchase price at $0 if you are not buying another home. Purchase year and month default to the sale date.
The purchase price minus the new mortgage is withdrawn in the purchase month and year. Sale proceeds stay invested and available in brokerage, not held in escrow. Include ongoing mortgage payments or rent in Spending.
Full eligibility: confirm the ownership and residence tests, both spouses' residence tests for a joint exclusion, and no disqualifying prior exclusion within two years. No exclusion is applied until confirmed. Entered sales are checked chronologically; another exclusion within 24 months, including the boundary month, is not applied. Exact-date eligibility, partial exclusions and other exceptions require separate tax review. See IRS Publication 523. Not modeled: rental or depreciation history, installment sales and like-kind exchanges. The property state is assumed to follow the federal exclusion.
Add notes about your spending plan, assumptions, or anything important to remember.
Plan for healthcare costs in retirement.
Enter your expected annual healthcare costs by phase.
Estimate Medicare premiums and IRMAA surcharges using prior-year MAGI.
Medicare Advantage user? Set Medigap / Supplemental to $0; an explicit $0 is honored.
Used to estimate income-related monthly adjustment amounts.
We’ll use this history to project IRMAA brackets and surcharges.
Set your market return and volatility assumptions.
Choose how investment returns are modeled in your plan.
Returns compound geometricallyNominal annual return before taxes and withdrawals.
Each account class grows at its own nominal rate. Cash & Other uses its own rate under Other assumptions (0% = held flat).
Phase rates apply to all accounts together — per-account rates aren't available in this mode. Your Blended / Per-Account choice is kept and applies again when you switch back to Fixed Rate.
Set your assumed volatility for market returns.
Taxable uses the profile above. Set Traditional and Roth overrides here when needed.
Applies in every returns mode. 0% holds Cash & Other at its entered value; it is spent first and never takes your investment return.
How often returns are compounded. Monthly (12x/year) is the most common default.
Set your tax profile and choose the strategy preferences that shape the plan.
How your ordinary income is taxed each year. The Automatic method applies the 2026 IRS brackets and standard deduction for your filing status, inflated over time; your state selection sets the state rate.
Used with the Automatic federal method. The flat method's state rate lives under Advanced.
Tax brackets and deductions grow at this rate in future years, as the IRS adjusts them for inflation.
Subtracted from income before tax. The default is the IRS standard amount for your filing status, indexed each year. Enter a different amount to itemize: it replaces the standard deduction and the 65+ add-on (itemizers don’t get it), is entered in today’s dollars and indexed the same way, and applies for all plan years; age-varying ranges live in Tax settings.
Extra standard-deduction add-on per person aged 65+ ($1,650/person MFJ, $2,050 single, 2026) in the years each of you qualifies. Leave it on — it is statutory; turning it off models a higher tax than the law charges.
Up to $6,000 per eligible person for tax years 2025–2028 only (OBBBA). Each person’s $6,000 is reduced by 6% of MAGI above $75K single / $150K jointly. Fully phased out at $175K single or $250K jointly, whether one or both spouses qualify. Not available married filing separately.
Withdrawals from IRA/401(k) are always taxed as ordinary income. Check additional income types to include in your tax calculation.
The plan computes how much of your Social Security is federally taxable using the IRS provisional-income tiers (0%, 50%, or 85% of benefits depending on income). Leave this checked for realistic taxes — low incomes automatically produce $0 taxable SS. Uncheck only to model SS as fully tax-exempt.
Unchecking removes ALL pension income from the taxable-income calculation — use only if your pension is genuinely tax-exempt. If unchecked, lifetime tax will be significantly understated. Check the "Taxable Income" line after running.
Wages in retirement are ordinary income (and payroll-taxed). Uncheck only if the figure you entered is already net of tax.
When you sell in a taxable account, only the gain portion is taxed. The plan seeds ONE tracked cost basis from your starting gain % below, adds basis for every dollar that enters the account (excess RMDs, deposits, saved surplus), and realizes gain on each sale at the share the account carries at that moment.
Rates are computed per year from your taxable income — nothing else to set. The bracket preview lives in Tax settings.
Unused capital losses from prior years. Applied against gains first, then up to $3,000/yr against ordinary income.
% of today’s brokerage balance that is growth above what you paid (check your statement’s unrealized gain). 0 means no embedded gain; negative means the account is below cost. This is the only gain input — it seeds the tracked basis.
After you finish, the Brokerage Gain/Basis Estimator in the Deep Dive tab shows the tracked basis, the share of each sale that was gain, and the cap gains tax paid, year by year.
Every year’s tax bill is paid from the plan: first from income left after spending, then from your accounts in the order you choose. Tax dollars taken from the IRA are themselves taxed, so the plan grosses that withdrawal up; dollars taken from brokerage realize gain.
Which account pays the tax that income after spending does not cover. Brokerage First keeps the IRA compounding.
Choose how the engine takes distributions. RMDs are always taken first.
Computed from your birth year under SECURE 2.0.
Move money from Traditional IRA/401(k) to Roth. The converted amount is taxed as ordinary income in the year of conversion, but then grows and withdraws tax-free. Leave amount at $0 to skip.
The amount is a flat nominal figure each year (not indexed). The tax on each conversion is paid like every other tax: from income left after spending, then from accounts in your Tax Funding order. Conversions raise the income Medicare premiums are priced on two years later (IRMAA). Need a year-by-year schedule? Use the Roth Conversion Explorer in the Deep Dive tab.
Deliberately sells brokerage positions in low-income years to realize gains while your capital-gains rate is 0%, then reinvests — raising your cost basis so future sales owe less tax. The realized amount is capped by the Harvest Rate.
Needs "Include capital gains tax" on and the Automatic LTCG method. Realizes gains from the plan’s tracked basis (seeded by your Starting Gain %) up to the room left in the 0% bracket after this year’s income and sale gains. No loss harvesting is modeled.
Share of the available 0% (and, if enabled, 15%) bracket room to use each year — not a share of the balance.
Pays 15% now to step up basis. Only worthwhile if later sales would land in the 20% bracket; if your withdrawal years are also at 15% it is pure timing drag (the Basis Estimator shows which).
Only needed with the flat federal method, or to change when withdrawals happen within each year.
When during each year withdrawals are taken — affects growth and tax sequencing.
Review your plan before running the simulation.
All required sections are complete. You're ready to run the simulation.
This takes a few seconds. Your inputs stay editable afterward.
Model income, withdrawals, taxes, and spending — know exactly how long your money lasts.
Sets your RMD start age, 59½ and 70½ dates, and Medicare/SS timing. Blank = inferred from your age.
Enter the benefit amount for the age you plan to claim. Find yours at ssa.gov/myaccount or on your annual SSA statement.
62 = reduced (~70%), 67 = full, 70 = max (~124%)
Annual cost-of-living adjustment. SSA historical avg ~2.5%. Set to 0 to model flat benefits.
The last age this pension pays. Set to life expectancy for a lifetime pension.
Age range for employment income.
Blank = grows with your inflation rate. Plans saved before this field existed keep flat wages (0).
Deposits to your IRA/401(k) pool each working year and reduces taxable wages; IRS deferral limits (incl. 50+ / 60–63 catch-up) apply.
After-tax; deposits to your Roth pool. Shares the same IRS deferral limit.
Dollar-for-dollar up to this share of what you defer (enter 3 for "100% of the first 3%"). Goes to your IRA/401(k) pool.
Adjusted annually for inflation.
Define your own spending phases. Set the end year for each phase and the annual amount. The last phase covers all remaining years. Each phase amount is in the dollars of the year that phase begins (it then inflates within the phase): a later phase entered as $59,500 is $59,500 in that future year, not today's dollars.
Spending adjusts dynamically with the portfolio's withdrawal rate (Guyton-Klinger). Set an initial spending amount and the guardrail bands around your initial withdrawal rate.
Each year the portfolio withdrawal rate — last year's actual draws (spending, healthcare and taxes net of Social Security, pensions and wages) over the opening balance — is compared with the bands around your initial rate: below the prosperity band spending rises by the increase amount; above the capital-preservation band it is cut by the decrease amount (not in the plan's last 15 years). The inflation raise is skipped after a losing year while the rate is above the initial rate. Floor and ceiling bound the result.
Draw from brokerage accounts first, then traditional IRA, then Roth. RMDs are always taken.
Your required minimum distribution is cash you must take. Spend first uses it toward the year’s spending before any other account is drawn, in every order. Reinvest deposits it into brokerage and funds spending from the chosen order as if it were not there — under Brokerage First that sells appreciated shares you did not need to sell.
When withdrawals are taken each year. Affects how much growth applies before money leaves the account. "Equal Throughout" models monthly withdrawals spread across the year (the same as a mid-year withdrawal on average).
One-time or multi-year extra withdrawals added on top of regular spending. Set From and To to the same year for a single-year withdrawal. Month controls when in the year the withdrawal occurs (affects growth).
One-time lump-sum deposits of after-tax money (e.g., inheritance, life insurance). For a home sale, use Home Sale below. Funds are added to your taxable account balance. Month controls when in the year the deposit occurs (affects growth).
Selling your home, a second home or other property? Enter it here, not as a deposit: enter today's value and a growth rate, or simply the price you expect in the sale year (a sale price, when entered, is used as is). The net proceeds are added to your taxable account, and the gain is taxed in the sale year after the home-sale exclusion ($250,000, or $500,000 married filing jointly, for a primary home you lived in 2 of the last 5 years). A property in another state is taxed at the higher of that state's rate and yours. Not modeled: rental or depreciation history, partial exclusions, installment sales and like-kind exchanges.
Enter an expected sale price, or estimate it using today’s value and annual appreciation.
A sale price above $0 overrides the value-and-growth estimate. Blank appreciation uses your plan’s inflation rate.
Cost basis is the original purchase price plus qualifying improvements. Tax on the sale’s gain is paid from the sale proceeds first; any shortfall follows your tax-funding order.
No home-sale exclusion is applied until full eligibility is confirmed. Review the eligibility and modeling notes below.
Leave the purchase price at $0 if you are not buying another home. Purchase year and month default to the sale date.
The purchase price minus the new mortgage is withdrawn in the purchase month and year. Sale proceeds stay invested and available in brokerage, not held in escrow. Include ongoing mortgage payments or rent in Spending.
Enter an expected sale price, or estimate it using today’s value and annual appreciation.
A sale price above $0 overrides the value-and-growth estimate. Blank appreciation uses your plan’s inflation rate.
Cost basis is the original purchase price plus qualifying improvements. Tax on the sale’s gain is paid from the sale proceeds first; any shortfall follows your tax-funding order.
No home-sale exclusion is applied until full eligibility is confirmed. Review the eligibility and modeling notes below.
Leave the purchase price at $0 if you are not buying another home. Purchase year and month default to the sale date.
The purchase price minus the new mortgage is withdrawn in the purchase month and year. Sale proceeds stay invested and available in brokerage, not held in escrow. Include ongoing mortgage payments or rent in Spending.
Confirm full exclusion eligibility: ownership and residence requirements, both spouses' residence tests for a joint exclusion, and no disqualifying prior exclusion within two years. No exclusion is applied until confirmed. Entered sales are checked chronologically; another exclusion within 24 months, including the boundary month, is not applied. Exact-date eligibility, partial exclusions and other exceptions require separate tax review. See IRS Publication 523.
Move money from Traditional IRA/401(k) to Roth. The converted amount is taxed as ordinary income in the year of conversion, but then grows and withdraws tax-free. Leave amount at $0 to skip.
Tip: Use the Roth Explorer strategy tool to find the optimal conversion amount, then enter it here to include it in your main projection.
Adds Medicare Part B, Part D, Medigap, IRMAA surcharges, and out-of-pocket costs to your annual spending. Costs grow at the healthcare inflation rate. IRMAA surcharges are based on your MAGI from 2 years prior (e.g., your 2026 Medicare premiums are determined by your 2024 income). For the first two years of your projection, NestMint uses the optional Prior Year MAGI fields below. If left blank, years 1–2 assume no IRMAA surcharge.
Set different return rates for different retirement phases.
Withdrawals from IRA/401k are always taxed as ordinary income. Check additional income types to include in your tax calculation.
Auto-set by filing status (2026 IRS amount).
$1,650/person MFJ, $2,050 single (2026). Only applies with standard deduction.
How ending wealth is valued after tax in the Strategy Engine and Roth Explorer. Inherited: the traditional IRA is taxed at your heirs’ marginal rate (a non-spouse heir must empty it within ten years); brokerage gains step up at death; Roth is tax-free. Liquidate: you sell everything — brokerage gains at the 0/15/20% capital-gains rates plus NIIT and state, the IRA drained over ten years on top of your final-year income. One method values every strategy.
Traditional IRA/401(k) withdrawals before age 59½ owe a 10% additional tax, which the plan pays like any other tax. Check this if a qualifying exception applies to your plan (separation from service at 55+ for a 401(k), a 72(t) series of substantially equal payments, disability, and others).
Up to $6,000/person ($12,000 MFJ). Phases out at MAGI > $75K single / $150K MFJ. Applies to both standard and itemized filers.
Determines tax brackets, standard deduction amounts, and long-term capital gains (LTCG) thresholds.
Simplified model: your state’s top marginal rate (2026) applied to federal taxable income — ordinary income and capital gains — with your state’s Social Security rules. Illinois, Pennsylvania and Mississippi exempt IRA/401(k) distributions and pensions. Graduated state brackets and partial retirement exclusions are not modeled; lower the rate if your income sits in a lower state bracket.
Annual inflation adjustment for tax brackets, standard deduction, and long-term capital gains (LTCG) thresholds. Set to 0% to use fixed 2026 levels. Historical IRS adjustments average ~2-3%.
Uses 2026 IRS tax brackets. Federal tax is computed progressively on taxable income after deductions.
How taxes are paid. Every year’s tax bill is paid from the plan: first from income left after spending, then from your accounts in the order below. Tax dollars taken from an IRA are themselves taxable, so that withdrawal is grossed up; dollars taken from brokerage realize gain. Any tax the plan cannot cover shows as Unmet Need.
Taxes paid from brokerage first — IRA compounds without tax-funding draws.
Configure long-term capital gains tax rate, brokerage gain estimates, auto-harvesting, and loss carryforward.
Key outcomes from your current retirement plan.
No simulation has been run yet for this plan. Run your first simulation to see projected outcomes, tax totals, RMD and IRMAA figures, and your current plan summary.
A quick comparison of withdrawal approaches under your current inputs. Open Strategy Engine for the full strategy analysis.
Total portfolio value across all strategies.
Total portfolio value across all strategies — no percentile band.
Income = Social Security, pension, and employment. Spending = the plan’s spending need.
Distribution of accounts over time. Based on account balances.
Includes SS, pensions, withdrawals, and conversions.
Choose how strategies are ranked and run the engine using the assumptions in your current plan.
Tests combinations of withdrawal order, Social Security timing, and Roth conversion schedules — every candidate is a full plan simulation under your current assumptions.
Each finalist is then stress-tested across 500 seeded market paths — the same paths for every strategy — and ranked by the outcome lens you choose.
See how different Roth conversion strategies would affect your lifetime taxes, RMDs, and ending net worth. The Explorer runs your full retirement simulation with and without conversions and compares the results. Tax on conversions is fully included — the converted amount is added to your taxable income each year, taxed at your federal + state rate, and reflected in all totals. A positive result means the upfront tax cost is outweighed by tax-free growth and lower future RMDs. A negative result means conversion costs more than it saves in your scenario — both outcomes are possible and the Explorer shows you which applies.
The core question is your tax rate today vs. your tax rate later.
Converting makes sense when your marginal rate during the conversion window is lower than the rate you'd pay on future RMDs. In that case, you prepay tax at a discount and all future growth is tax-free. The benefit compounds over 20–30 years and can be substantial.
Converting hurts when your current marginal rate equals or exceeds your expected future RMD rate. You'd be paying more tax today to avoid less tax later — a net loss that also compounds over time.
What drives the future RMD rate? Once large income sources like a pension or employment income end, your taxable income often drops significantly. Social Security and RMDs alone may put you in a lower bracket than you're in today — especially in the years before RMDs begin. That's typically where the opportunity lies.
What raises your current conversion rate? Pension income, employment income, and Social Security all stack on top of any conversion amount, pushing the marginal rate on the converted dollars higher. If your income is already high, conversions may land in the 24–35% federal bracket before state tax is added.
The Explorer below runs both scenarios for you and shows the actual dollar impact. Check the tax rate column to see what rate each strategy is effectively paying — and compare that to your projected RMD-year rate.
There is no IRS limit on how much you can convert per year. However, bigger is not always better. Key trade-offs:
The sweet spot — if one exists — is typically converting enough to fill your current tax bracket without jumping to the next one, or staying below the first IRMAA threshold. For some users, the optimal conversion amount is zero: if your income during the conversion window already exceeds your projected RMD rate, conversion increases lifetime taxes rather than reducing them. The Explorer's tax rate column shows the effective rate you'd pay on each strategy so you can compare it directly to your expected future rate.
These constraints apply only to "Compare Scenarios". IRMAA cap keeps MAGI below the first surcharge tier. Max bracket limits conversions. Min liquidity ensures brokerage stays above this floor.
Adjust assumptions and stress-test your retirement plan. Change return rates, life expectancy, inflation, SS timing, and spending to see how each affects your outcome.
How would your plan survive a major market crash? Pick a scenario, choose when the crash hits, and see the impact — including the recovery rally.
Run your retirement plan through 2,000 seeded market paths sampling annual returns around your expected return. Instead of one straight-line projection, see the modeled success rate and the range of possible outcomes. Same inputs always produce the same results.
Understand your effective tax rate in retirement and explore strategies to minimize lifetime taxes. Includes tax bracket analysis and the impact of relocating to a different state.
A sanity check on the Gain % you've entered in Tax Settings. Enter your estimated embedded gain today, and this tool projects how the blended gain % in your brokerage will actually evolve over time — accounting for fully-taxed RMD inflows (which arrive at 100% basis) and investment growth (which adds pure gain). If the projected line diverges significantly from your flat assumption, your cap gains tax estimates may be off.
Your best estimate today — check your brokerage statement for unrealized gain. This is the same field as Tax Settings → Starting Gain % (one number seeds the plan's tracked cost basis); 0 means no embedded gain, and a negative % means the account is below your cost (an unrealized loss the plan will realize as it sells). A higher % is more cautious from a tax perspective.
Comprehensive risk analysis with Monte Carlo success probability, tax burden, RMD exposure, and 5 more risk factors. Adjust the scenario sliders below to stress-test how changing assumptions affects your risk profile — without changing your main inputs.
What if you retired 30 years ago with your current balances? This shows how actual S&P 500 returns — including the dot-com crash, 2008 financial crisis, and COVID — would have affected your portfolio.
Compare different withdrawal sequences to see which order of drawing from your accounts preserves wealth the longest. Your current withdrawal order setting from the inputs above is highlighted.
Review your projected Required Minimum Distribution schedule starting at your RMD age (73 or 75, set by your birth year), based on your projected IRA/401(k) balance at that age (not your current balance). RMD amounts are calculated using the IRS Uniform Lifetime Table. See how RMDs grow over time, their tax impact, and strategies to reduce them through early withdrawals or Roth conversions.
Evaluate whether your planned spending is sustainable. See your effective withdrawal rate, how it compares to common benchmarks, and when adjustments might be needed.
Model Medicare premiums, IRMAA surcharges, Medigap supplements, and out-of-pocket costs through retirement. Healthcare inflation (~5.8%) outpaces general inflation — see how it compounds and what share of your spending goes to medical costs.
Compare claiming Social Security at different ages to see how each option affects your lifetime benefits, ending balance, and total income. Includes break-even analysis and COLA growth projections.
Get age-appropriate asset allocation suggestions for your retirement accounts. See how shifting between stocks, bonds, and cash affects your projected outcomes over time.
See a visual timeline of key retirement milestones — from Social Security eligibility and Medicare enrollment to RMD start dates, spending phase changes, and projected fund depletion. Understand what happens at each stage.
A year-by-year breakdown of the first 10 retirement years: where your taxable income comes from, how the tax breaks down by type, and which account funded each tax dollar. Useful for spotting bracket-creep and brokerage-drain patterns.
Inspect the year-by-year simulation data, export to CSV for external verification, and review engine diagnostics. Useful for validating results against your own spreadsheet or tax preparer’s projections.
Assumptions changed since this projection — press Run to refresh these windows.
Shared axis; per-person events where timing differs; household opportunities appear once.
Events are grouped by person, followed by household opportunities. Detailed windows are below.
Household opportunity
From 2026 through 2033. Ends when Social Security begins.
Per person
Open since 2026. Income from this year on sets Medicare premiums two years later (the lookback); the band stays open for life.
Per person · dated event
First RMD year: 2038. May defer first distribution to April 1, 2039; deferral bunches two RMDs into that tax year.
Per person · partially elapsed
Claim window: 2025 – 2033. Each year of delay raises the monthly benefit for life. Claiming before full retirement age while still working can temporarily withhold benefits (earnings test).
Per person
Open since 2026. Income from this year on sets Medicare premiums two years later (the lookback); the band stays open for life.
Per person · dated event
First RMD year: 2038. May defer first distribution to April 1, 2039; deferral bunches two RMDs into that tax year.
Per person · partially elapsed
Claim window: 2025 – 2033. Each year of delay raises the monthly benefit for life. Claiming before full retirement age while still working can temporarily withhold benefits (earnings test).
Household exposure
MFJ brackets last only while you both do. This is an exposure, not an open/closed window, and it has no close date.
Household exposure
Your state taxes Social Security above an income line. Roth conversions and large withdrawals count toward it — crossing can add state tax on your benefits.
Household window
The subsidy cliff is back: marketplace premium credits now end entirely at the federal poverty-line threshold. Conversions, withdrawals, and untaxed Social Security all count toward it — until Medicare begins.
Temporary statutory window
Eligible window: 2028 – 2028. Not applicable to your plan. OBBBA is the 2025 federal tax law (the “One Big Beautiful Bill Act”). It added an extra $6,000 standard deduction per person aged 65+ for tax years 2025–2028, phasing out above $75,000 of income ($150,000 married). The window is the years you or your spouse are 65+ while it is on the books; a dash means nobody in the plan is 65 before it sunsets.
Reached 2023. Penalty-free access to retirement accounts.
Modeled transition begins 2028.
—
—
Modeled transition begins 2028.
—
—
Eligible around 2034. Not modeled in the projection.
Temporary eligibility window: 2025–2028 (tax years).
Projections are based on your plan assumptions and current law. Estimates only — not tax or investment advice.
| Timeline | Portfolio | Income | RMDs & IRAs | Spending & Healthcare | Withdrawals | Taxable Income & Gains | Taxes | Cash Flows | Contributions | End-of-Year Balances | ||||||||||||||||||||||||||||||||
|---|---|---|---|---|---|---|---|---|---|---|---|---|---|---|---|---|---|---|---|---|---|---|---|---|---|---|---|---|---|---|---|---|---|---|---|---|---|---|---|---|---|---|
| Age | Year | Beg Bal | Growth ⓘ | SS Inc | Pension | Employ | RMD ⓘ | Exc RMD | IRA/401(k) Beg ⓘ | Spouse IRA Beg ⓘ | Spend Need ⓘ | HC Base | HC IRMAA | Spend W/D ⓘ | IRA → Spend ⓘ | Spcl W/D | Ord Tax Inc | Deduction ⓘ | Est Tax Inc | Brkt Room | Brkt Used | Roth Conv | Cap Gain | Cap L Used | Net Gain | Loss C/O | Base Fed | Base St | CG Tax | G-U Tax | Tot Tax | Spend W/D | Spcl W/D | Tax W/D | Tot W/D | Spcl Dep ⓘ | Contrib ⓘ | IRA/401k | Roth | Brokerage | Cash ⓘ | End Bal |
Presentation: Spend Need is shown accounting-style — red parentheses denote a cash outflow. The underlying value is the plan’s spending target for the year; the CSV export carries the plain number.
Withdrawals: Spend W/D = withdrawal for living expenses. Spcl W/D = special withdrawal (also taxed). Tax W/D = withdrawal to fund taxes. Tot W/D = Spend W/D + Spcl W/D + Tax W/D. Spend W/D appears twice: once next to Spend Need (includes Spcl W/D) and again in the withdrawal math section (excludes Spcl W/D, shown separately).
Income & Tax: Ord Tax Inc = ordinary taxable income before deductions. Deduction = standard or custom deduction applied. Est Tax Inc = Ord Tax Inc − Deduction (estimated taxable income, ties to Tax Bracket Management). Roth Conv = amount converted from Traditional to Roth (included in Ord Tax Inc). Note: If the Enhanced Senior Deduction (One Big Beautiful Bill, 2025–2028) is enabled, you will see a step-down in the Deduction column in the first year after it expires — this is correct and reflects the provision's scheduled end date.
Bracket Fill (Tax-Smart): Brkt Room = how much IRA withdrawal room exists before hitting the target bracket ceiling (ceiling − base income). Brkt Used = actual IRA withdrawal taken to fill the bracket; this amount is included in Ord Tax Inc and taxed accordingly. If RMD exceeds the room, the excess is reinvested into brokerage. These columns are zero when not using Tax-Smart withdrawal order. Click any cell for the full breakdown.
Capital Gains: Cap Gain = gross capital gain from brokerage withdrawals. Cap L Used = capital loss carryforward applied against gains. Net Gain = Cap Gain − Cap L Used. Loss C/O = remaining capital loss carryforward.
Tax Computation: Base Fed = federal tax on ordinary income. Base St = state tax on ordinary income. CG Tax = Net Gain × LTCG rate. G-U Tax = gross-up tax from funding taxes via IRA. Tot Tax = Base Fed + Base St + CG Tax + G-U Tax, plus payroll tax (FICA) on wages in working years (click the Tot Tax cell for the year’s breakdown).
Eight focused steps. Your answers update the existing Savings Estimator automatically.
Add assets and debts outside your retirement plan to see your complete financial picture.
Retirement and investment accounts already entered in NestMint are included automatically.
Do not enter those accounts again here.
Only assets not already included in your NestMint savings or retirement accounts.
Enter current balances, not original loan amounts.
Optional. These entries calculate your broader net worth and do not change Savings Estimator or Retirement Planner projections.
Save to create your Asset & Liability Overview. You can update these values at any time.
A broader net-worth view kept separate from the assets used in your retirement projection.
Not yet saved
Save future updates to build your net-worth history.
Track every dollar in and out — whether it's a paycheck or a pension.
Monthly expenses by category
Review, export, and share the analysis already produced by your planning tools.
Headline projections, detailed annual results, and complete plan exports.
A shareable summary of assumptions, balances, income, spending, taxes, and projected outcomes.
Export the complete annual projection for further review in a spreadsheet.
Open the current plan's charts, account balances, taxes, withdrawals, and annual spreadsheet.
Explore factual differences among withdrawal approaches and inspect every calculation.
Compare withdrawal strategies against the same retirement-plan assumptions.
Open all detailed sections, including accounts, taxes, cash flow, healthcare, RMDs, Monte Carlo, and legacy analysis.
Review conversion comparisons, projected taxes, future RMDs, and ending wealth.
Generate focused reports from the other areas of your financial workspace.
Export the current savings projection, assumptions, and accumulation results.
Export income, expenses, savings rate, and multi-year budget projections.
Open beneficiary, estate-transfer, tax, and inheritance projections based on the current plan.
All your saved work in one place. Click any item to open it.
No saved scenarios yet
No saved scenarios yet
No saved scenarios yet
No other data
Your date of birth and state feed your plan: state drives the state-tax model, and ages drive projections.